Page 30 -
P. 30

3.3    Motion graphs of acceleration and


                          deceleration


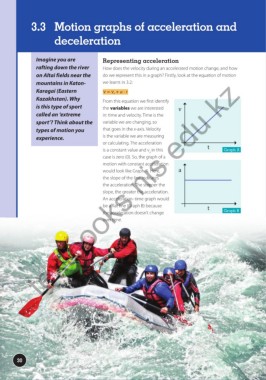
                 Imagine you are                Representing acceleration
                 rafting down the river         How does the velocity during an accelerated motion change, and how

                 on Altai fields near the       do we represent this in a graph? Firstly, look at the equation of motion
                   textbooks nis edu kz
                 mountains in Katon-            we learnt in 3.2:
                 Karagai (Eastern                v = v o  + a ∙ t
                 Kazakhstan). Why               From this equation we first identify

                 is this type of sport          the variables we are interested    v
                 called an ‘extreme             in: time and velocity. Time is the
                 sport’? Think about the        variable we are changing, so
                 types of motion you            that goes in the x-axis. Velocity

                 experience.                    is the variable we are measuring
                                                or calculating. The acceleration
                                                is a constant value and v in this               t       Graph A
                                                                     o
                                                case is zero (0). So, the graph of a
                                                motion with constant acceleration
                                                would look like Graph A. Here,     a
                                                the slope of the line indicates
                                                the acceleration. The steeper the
                                                slope, the greater the acceleration.
                                                An acceleration–time graph would
                                                be a flat line (Graph B) because
                                                                                                t       Graph B
                                                the acceleration doesn’t change
                                                over time.


         30
   25   26   27   28   29   30   31   32   33   34   35