
Page 31 -
P. 31
Physics
Calculating distance travelled from a
velocity–time graph v
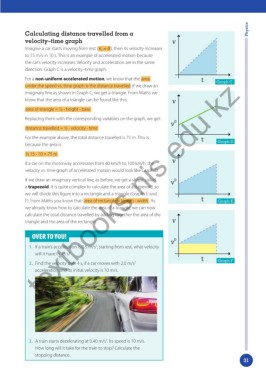
Imagine a car starts moving from rest ( v o = 0 ), then its velocity increases
to 15 m/s in 10 s. This is an example of accelerated motion because
the car’s velocity increases. Velocity and acceleration are in the same
direction. Graph C is a velocity–time graph.
For a non-uniform accelerated motion, we know that the area t Graph C
under the speed vs. time graph is the distance travelled. If we draw an
imaginary line as shown in Graph C, we get a triangle. From Maths we
know that the area of a triangle can be found like this:
v
area of triangle = ½ ∙ height ∙ base
Replacing them with the corresponding variables on the graph, we get: vedu kz
0
v
distance travelled = ½ ∙ velocity ∙ time
For the example above, the total distance travelled is 75 m. This is
t Graph D
textbooks nis
because the area is
½ 15 ∙ 10 = 75 m
If a car on the motorway accelerates from 40 km/h to 100 km/h, the
velocity vs. time graph of accelerated motion would look like Graph D.
If we draw an imaginary vertical line, as before, we get a shape called 0
v
a trapezoid. It is quite complex to calculate the area of a trapezoid, so
we will divide this figure into a rectangle and a triangle (Graphs E and
F). From Maths you know that: area of rectangle = length ∙ width . As t Graph E
we already know how to calculate the area of a triangle, we can now
calculate the total distance travelled by adding together the area of the
triangle and the area of the rectangle. v
OVER TO YOU!
v 0
1. If a train’s acceleration is 0.5 m/s , starting from rest, what velocity
2
will it have in 15 s?
t Graph F
2
2. Find the velocity over 4 s, if a car moves with 2.0 m/s
acceleration and its initial velocity is 10 m/s.
3. A train starts decelerating at 0.40 m/s . Its speed is 10 m/s.
2
How long will it take for the train to stop? Calculate the
stopping distance.
31