Page 20 -
P. 20

2.3   Analyzing uniform motion


                 Look at the graphs             Representing velocity and displacement for a
                 on this page. What             uniform motion
                 information can                a)  Velocity (speed) equal to zero

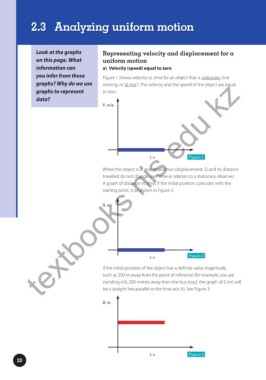
                 you infer from these           Figure 1 shows velocity vs. time for an object that is stationary (not
                   textbooks nis edu kz
                 graphs? Why do we use          moving, or ‘at rest’). The velocity and the speed of the object are equal
                 graphs to represent            to zero.

                 data?
                                                V, m/s


                                                                      t, s             Figure 1


                                                When the object is at rest, its position (displacement, S) and its distance
                                                travelled do not change over time in relation to a stationary observer.
                                                A graph of distance vs. time, if the initial position coincides with the
                                                starting point, is as shown in Figure 2.


                                                S, m


                                                                      t, s              Figure 2

                                                If the initial position of the object has a definite value magnitude,
                                                such as 200 m away from the point of reference (for example, you are
                                                standing still, 200 metres away from the bus stop), the graph of S (m) will
                                                be a straight line parallel to the time axis (t). See Figure 3.


                                                S, m


                                                                      t, s             Figure 3
         20
   15   16   17   18   19   20   21   22   23   24   25