
Page 21 -
P. 21
Physics
b) Velocity (speed) not zero but constant
S, m V, m/s
Let us now consider an example in which an object
moves with constant speed (such as a cruising
airplane or a car travelling along a motorway).
See Figure 4.
● When plotting a graph it is necessary to define the
For example, assume an escalator moves at a speed of 0.8 m/s, then S = 0.8 · t .edu kz
correct axis. We must identify both the dependent
(y-axis) and independent (x-axis) variables. Figure 4
t, s t, s
● When investigating how an object’s position
(displacement) changes with time, we know that time is the independent variable (the
variable we are changing) and distance is the dependent variable (the variable we are
measuring as time changes).
We know from the previous lesson that when the velocity of an object is constant, we can
use this equation to calculate the distance travelled over time:
is: = 2 + 4 textbooks nis
d = s · t
(or S = v · t , if using the vector quantities)
Since the escalator moves uniformly at a speed of 0.8 m/s, a vt graph is a straight line
parallel to the axis t. This means that the speed of object does not change over time.
OVER TO YOU!
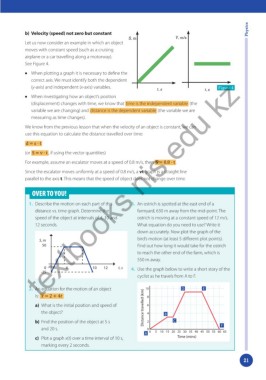
1. Describe the motion on each part of this 3. An ostrich is spotted at the east end of a
distance vs. time graph. Determine the farmyard, 630 m away from the mid-point. The
speed of the object at intervals of 4, 10 and ostrich is moving at a constant speed of 12 m/s.
12 seconds. What equation do you need to use? Write it
down accurately. Now plot the graph of the
bird’s motion (at least 5 different plot points).
S, m
50 Find out how long it would take for the ostrich
to reach the other end of the farm, which is
550 m away.
0 4 10 12 t, s 4. Use the graph below to write a short story of the
-25
cyclist as he travels from A to F.
2. An equation for the motion of an object D E
Distance travelled (km) 10
a) What is the initial position and speed of 8 6
the object? 4 B
b) Find the position of the object at 5 s 2 C
and 20 s. 0 F
A 0 5 10 15 20 25 30 35 40 45 50 55 60 65
c) Plot a graph x(t) over a time interval of 10 s, Time (mins)
marking every 2 seconds.
21